Estimated Bubble Diameter
Air in clean water at 20°C · 0.30 m diffuser depth
Experimental bubble-curtain testing supported by a custom Python pipeline for extracting bubble size and motion from difficult high-speed footage.
Air in clean water at 20°C · 0.30 m diffuser depth
Production: approximately 1,350 bubbles/s across 19 nozzles
Different nozzle diameters were tested across specific pressure ranges. Each configuration was recorded and analysed separately.
Media on this page · 2 mm nozzle · 1.6 barThe broader bachelor project investigated how operating conditions influence bubble-curtain behaviour.
Bubble overlap, merging, separation and changing shape made persistent tracking difficult.
I created a Python workflow for segmentation, detection, classification and frame-to-frame comparison.
Each frame moved through boundary isolation, region filling and object classification before geometric measurements were extracted.
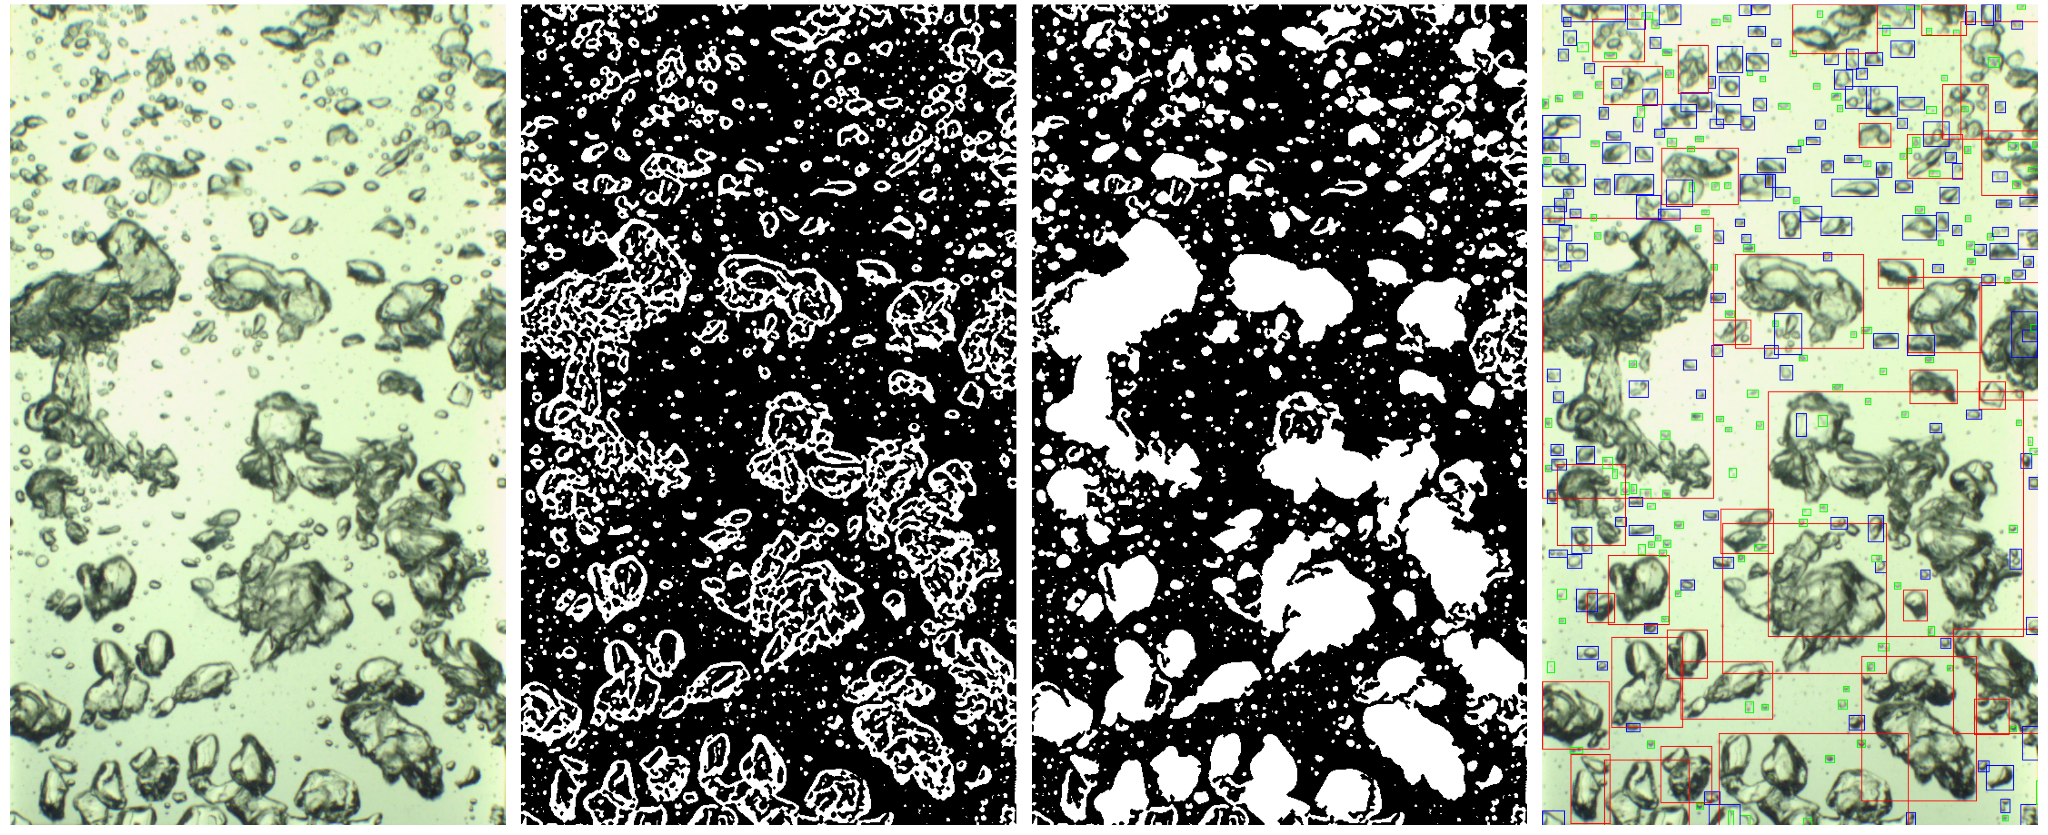
Longer sequences repeatedly redefined the same physical bubble as it merged, separated or changed shape.
Three consecutive frames retained useful displacement information while limiting unstable identity changes. Further analysis then produced representative diameter and velocity values.
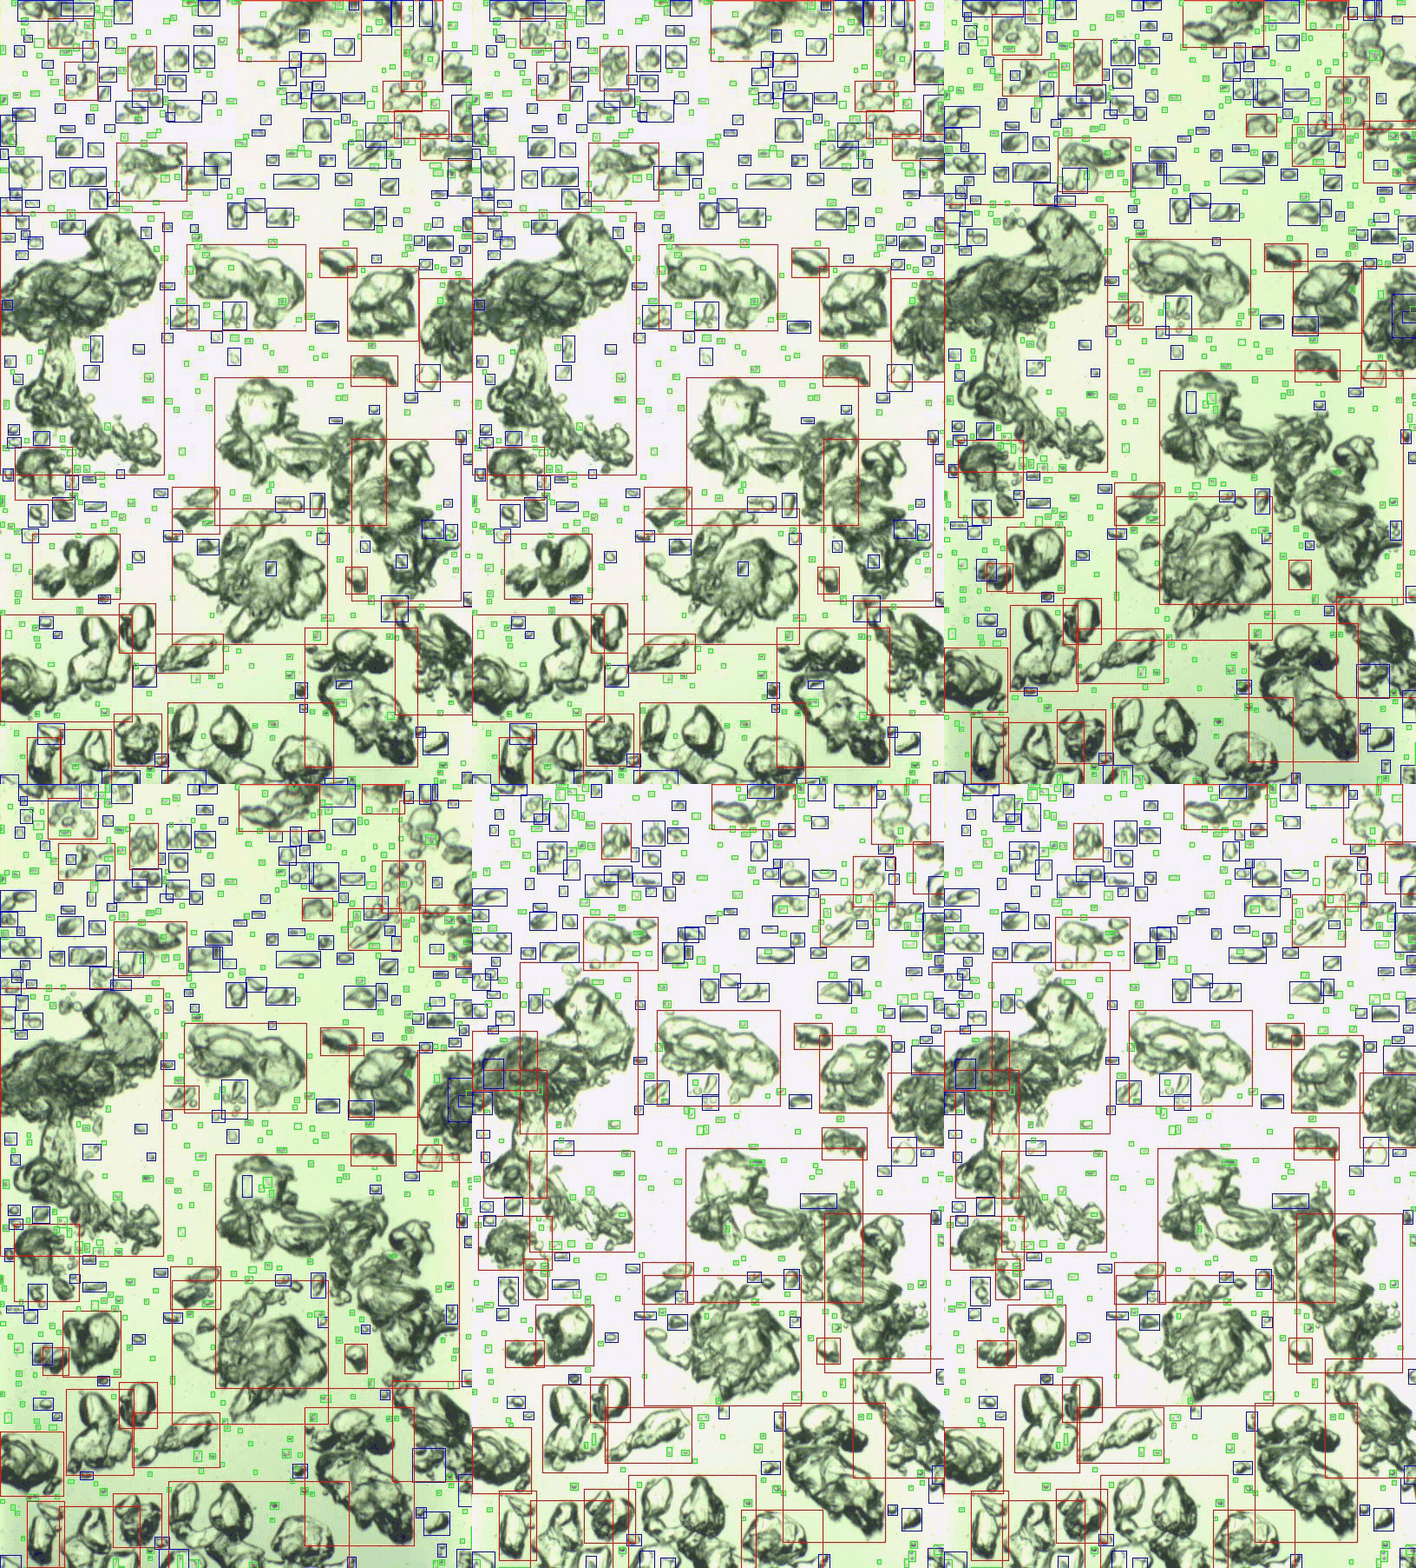
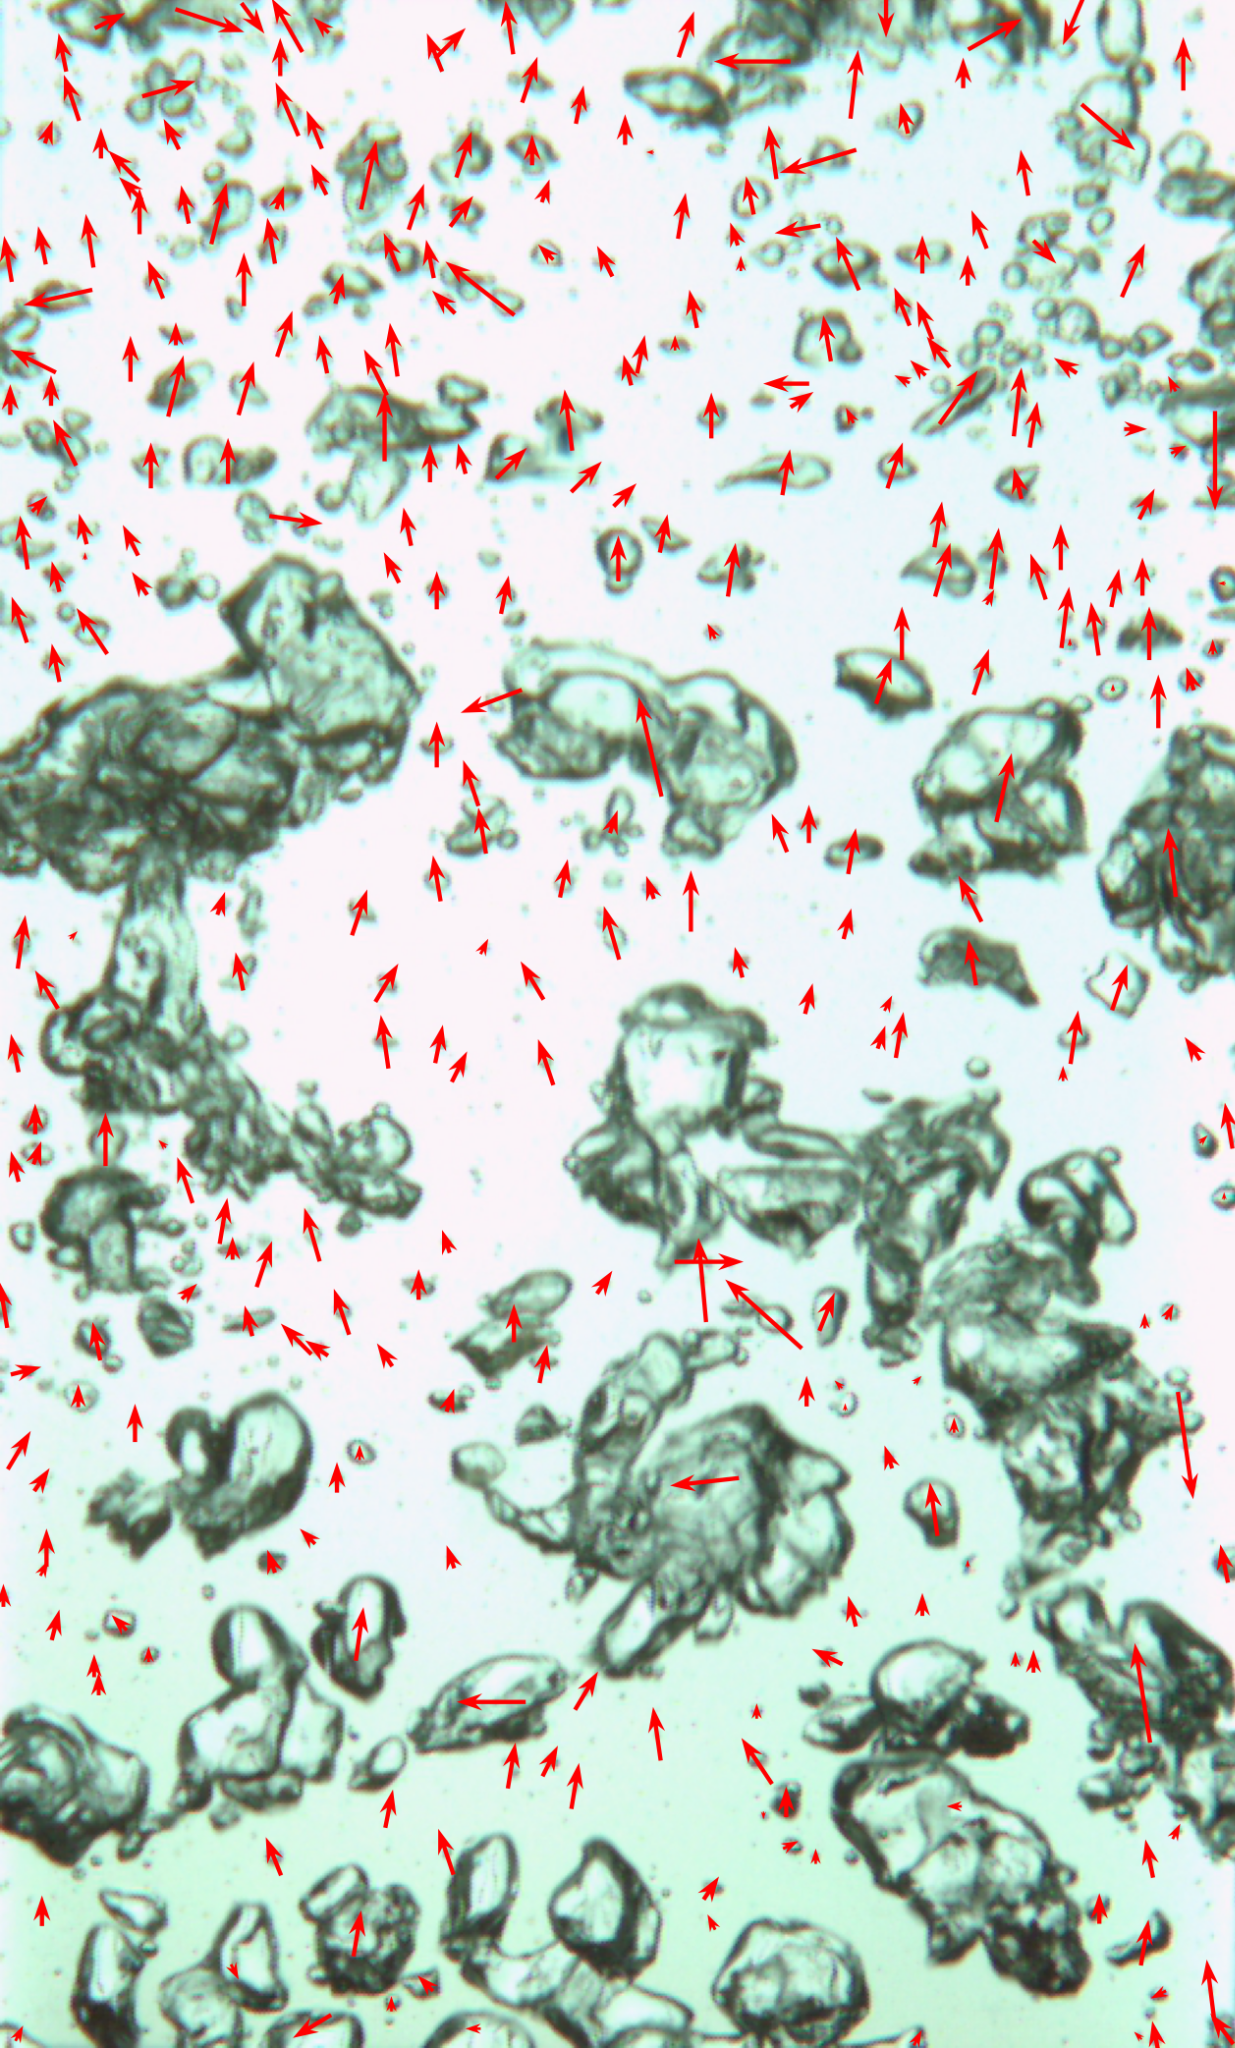
Matched regions were compared to estimate displacement between consecutive frames.
The vector field shows the dominant upward movement together with lateral motion, local interaction and uncertain matches caused by irregular bubble shapes.
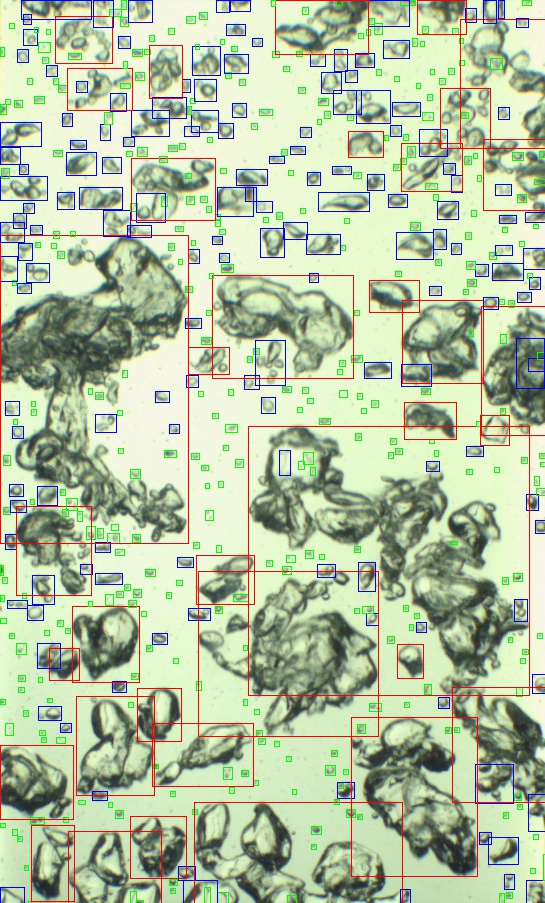
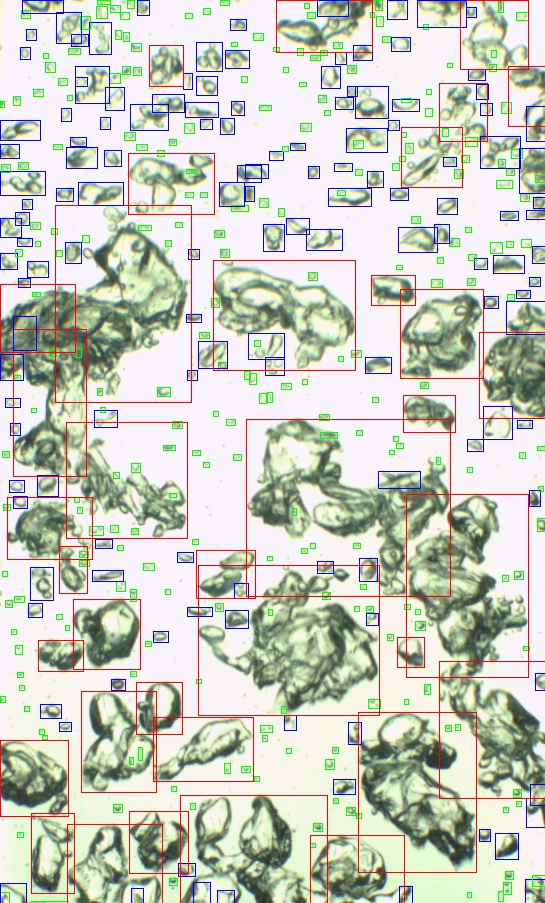
The paired videos show the raw image quality and the detections generated by the analysis pipeline.
These frames demonstrate one configuration only. The complete study included other nozzle and pressure combinations.
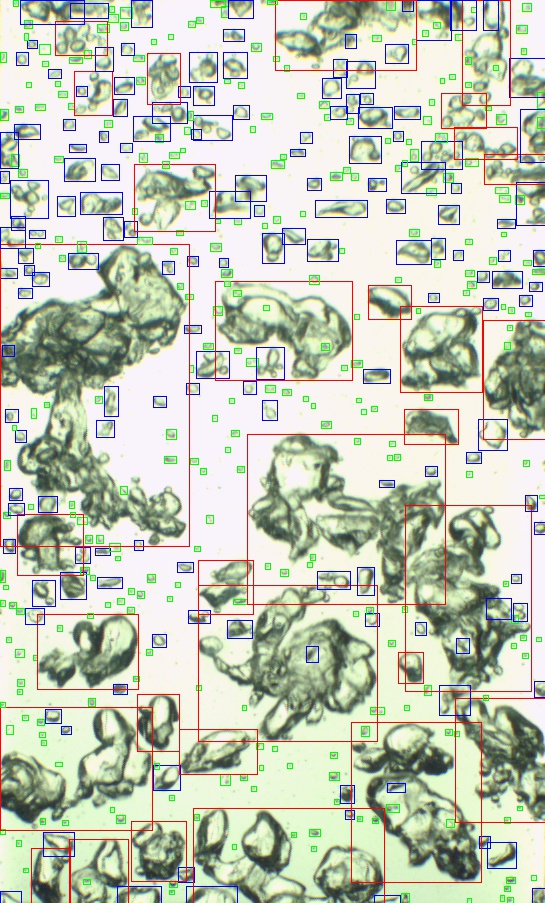
The workflow provided a transparent basis for estimating bubble diameter and velocity within the project constraints.
A stronger optical setup would improve tracking confidence. The selected method nevertheless produced a structured and reproducible analysis route.