Project 02 · Case study
Particle-based modelling
Methane Molecular Dynamics Solver
A custom NVT simulation for studying pressure, phase behaviour and molecular structure across gas and liquid states.
Compare molecular motion
Liquid · 358.4 kg/m³ · 400 K
Solver architecture
Built from the particle level
The workflow covers system initialization, intermolecular forces, integration, thermostat control and simulation output.
Initialize
Create a cubic particle configuration and a temperature-scaled velocity field.
Interact
Evaluate truncated Lennard-Jones forces using periodic minimum-image distances.
Integrate
Advance particle positions and velocities with the Velocity Verlet algorithm.
Control
Maintain the target temperature through a deterministic Nosé-Hoover thermostat.
Verification
Checked against reference MD data
Temperature, pressure and energy behaviour were compared with a LAMMPS reference simulation before using the solver for the phase study.
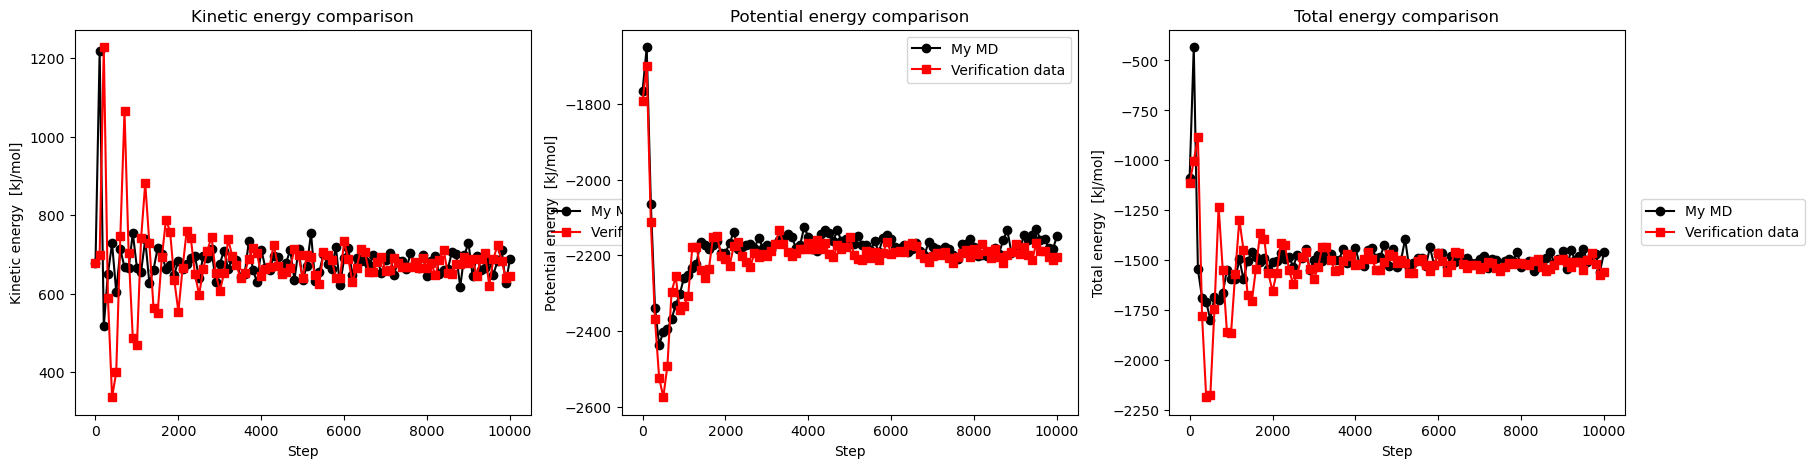
At 150 K and 358.4 kg/m³, the total energy settles into stable fluctuations after the initial transient.
The selected value produced the smallest mean absolute temperature error among the tested settings.
The verified solver was then used across two densities and four temperatures.
Phase evolution
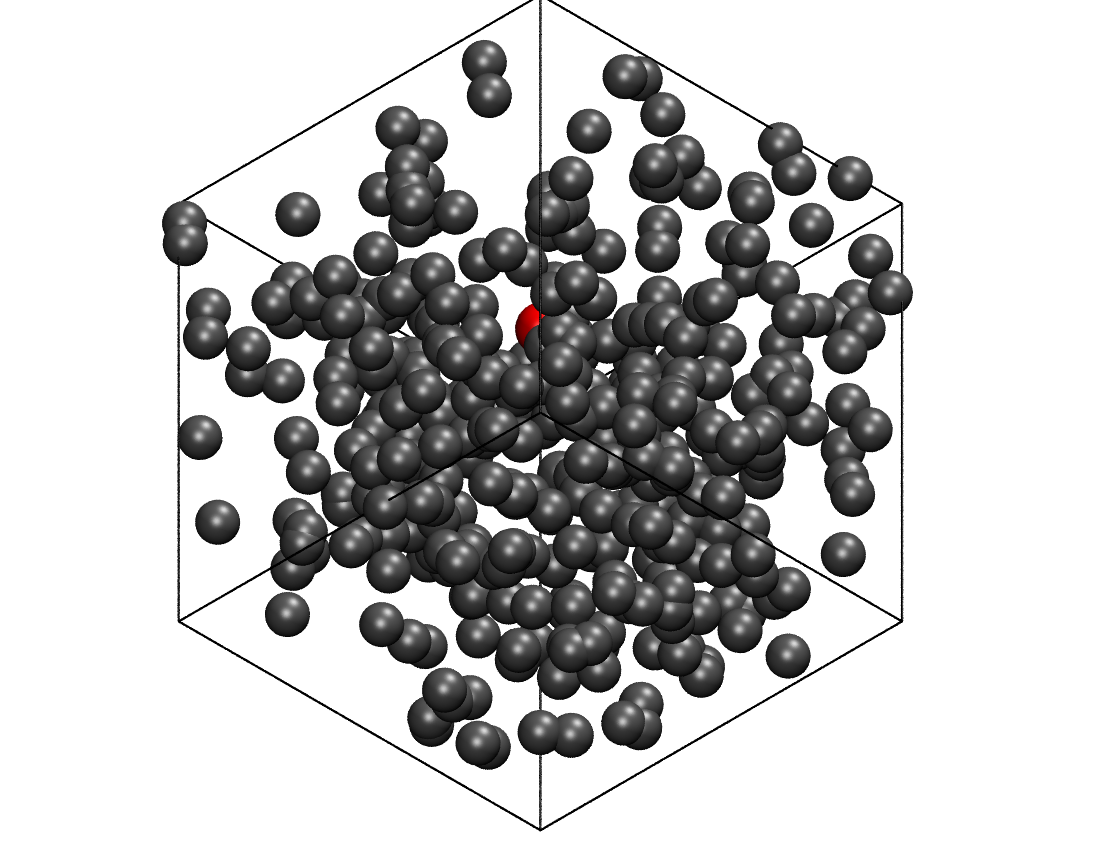
The same model, two molecular states
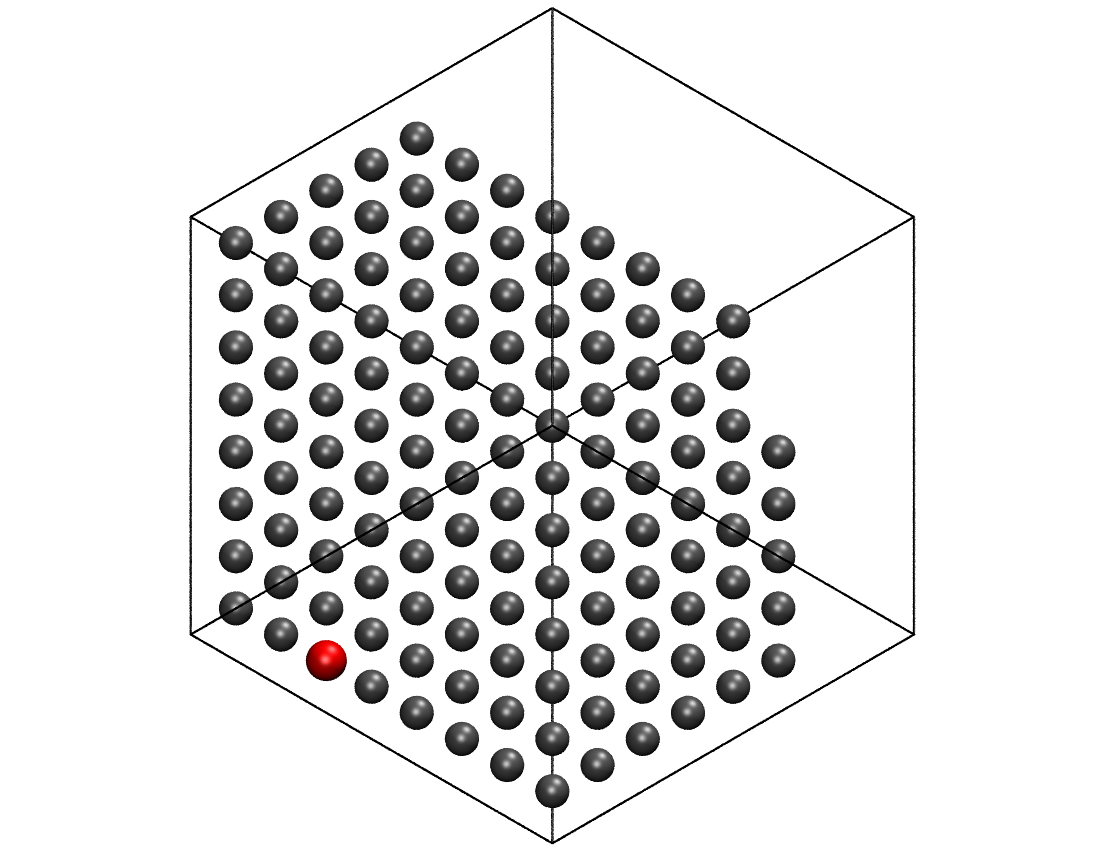
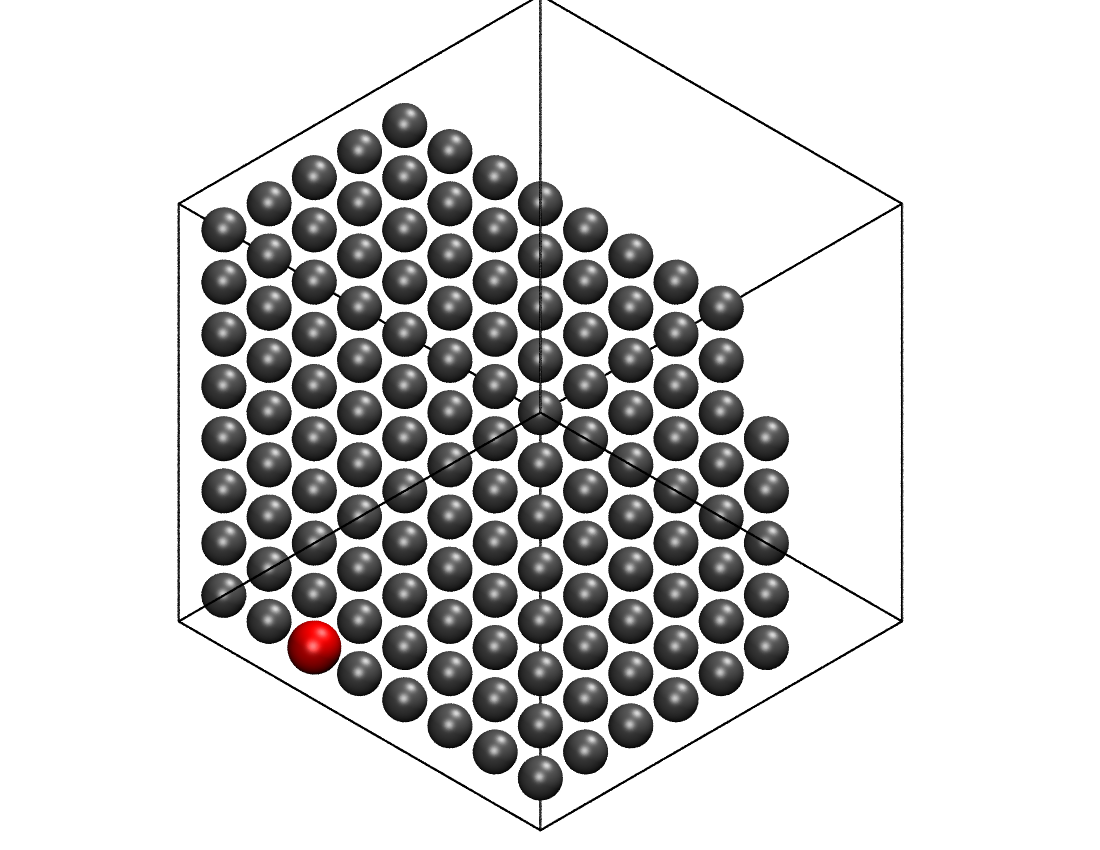
At 400 K, density changes the spatial organisation more strongly than the particle model itself.
Liquid state
358.4 kg/m³ · 400 K
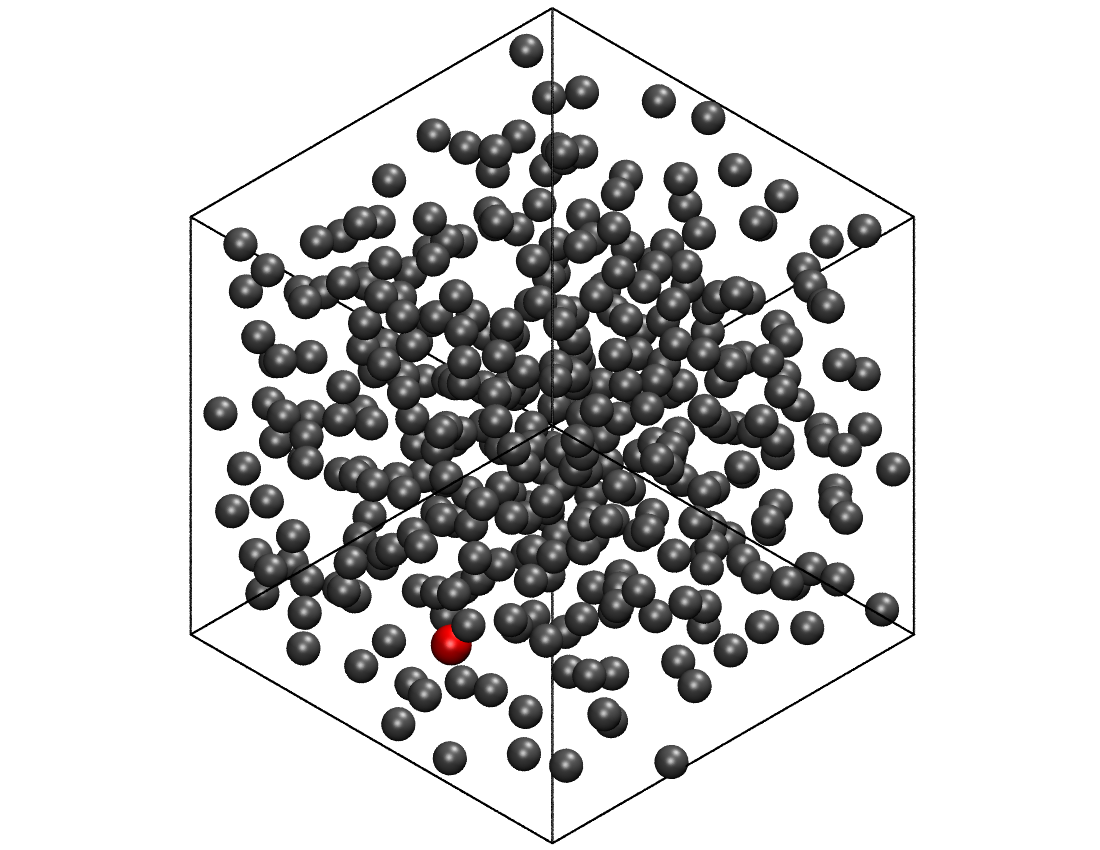
Gas state
1.6 kg/m³ · 400 K
Thermodynamic response
Pressure across temperature and density
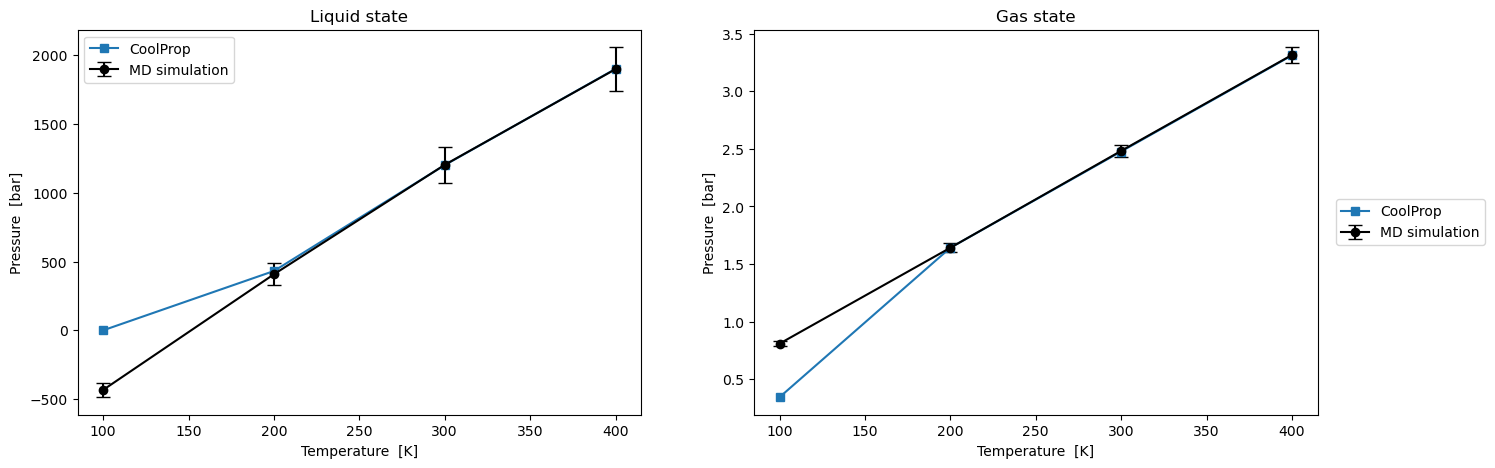
Simulations were evaluated at 100, 200, 300 and 400 K for the liquid-density and gas-density states.
Pressure rises with temperature in both cases. Agreement with the real-fluid reference is strongest from 200 to 400 K, while the simplified Lennard-Jones model shows its largest deviation at 100 K.
Radial structure
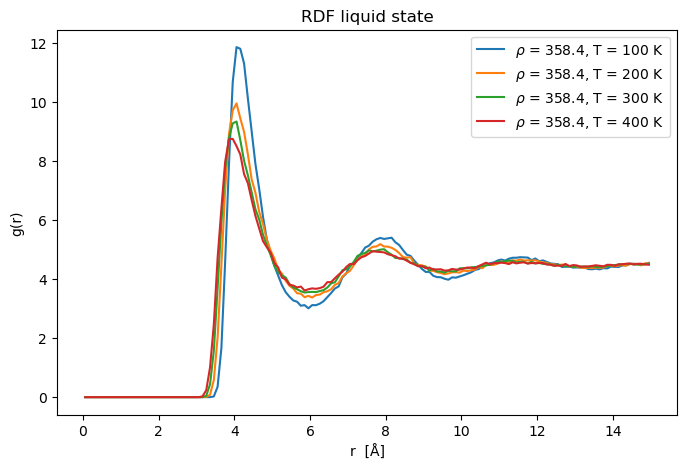
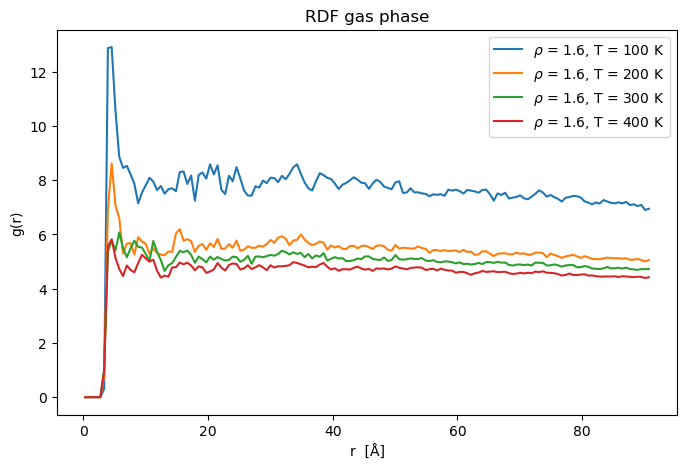
Molecular order through radial distribution
The radial distribution function separates the organised neighbour shells of the liquid from the weaker structure of the gas.
Engineering outcome
A reusable foundation for molecular transport studies
The project produced a verified methane MD workflow covering forces, integration, temperature control, thermodynamic response and molecular structure.
The same solver later became the basis for a separate self-diffusion study using unwrapped trajectories, mean-squared displacement and finite-size correction.
Explore the methane self-diffusion study